Too Many Shifts, Not Enough Time? Try LibStaffer’s Auto Scheduler
By Kelsey on June 6, 2025

Managing library staff schedules can often feel like solving a complex math equation, with numerous variables such as different departments, diverse positions, varying skill sets, and multiple buildings to consider. This task can be overwhelming, but LibStaffer is here to simplify the …
Shake Up Your Summer with Exciting New Products from Springshare
By Hannah on June 3, 2025

Whether you're catching up on projects between semesters or ramping up for the ultimate Summer Reading Program, you'll want to carve out time in the coming weeks to learn about some exciting new products from Springshare! We're passionate about helping libraries thrive in a digital-fi …
LibCal, LibAnswers, LibGuides, LibInsight, and LibWizard Features Coming Your Way!
By Sarah on May 30, 2025

These releases are on their way to you next week, and will be live in all regions by the end of the day on Friday, June 6, 2025.
Tales From the Co-Op: May Exchanges
By Hannah on May 27, 2025

We are back with the latest edition of Tales From the Co-Op! If you haven't had the chance to read last month's post in this series, be sure to check out our April exchanges. The 24/7 Chat Cooperative is an adaptable service, designed to meet the needs of modern libraries through a ne …
Managing Room Reservations for Libraries of All Sizes
By Kirsten on May 23, 2025

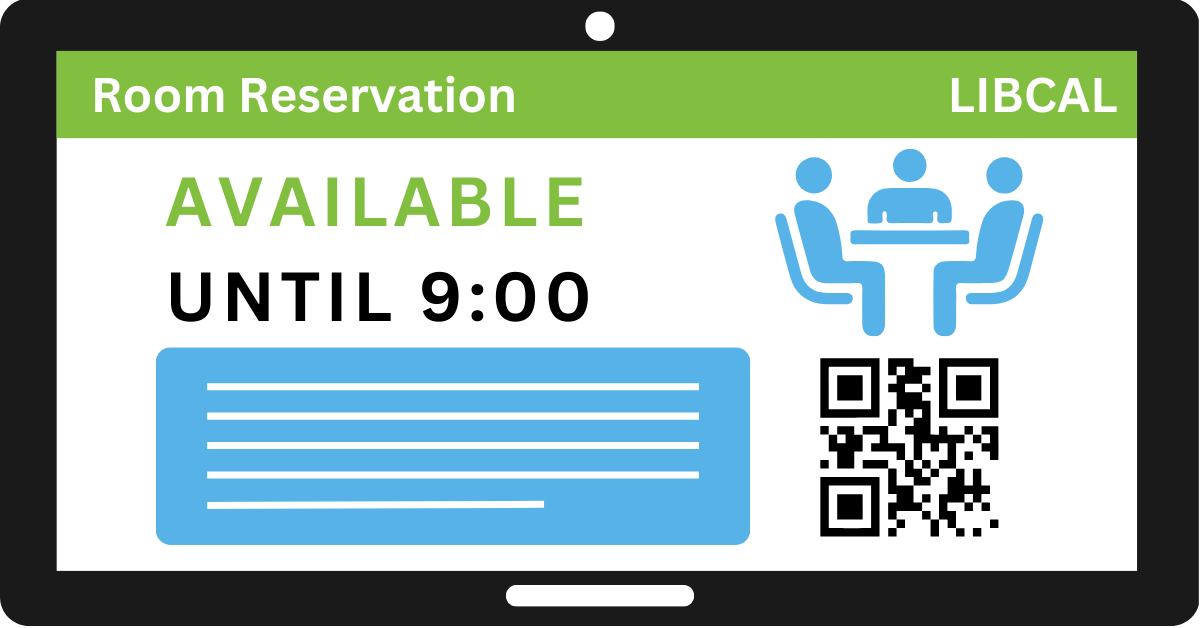
No two libraries are exactly alike. A small community library might have just one meeting room and a study nook. A sprawling academic library might manage dozens of study rooms, presentation spaces, and computer labs across multiple floors—or even multiple campuses. No matter the size …
Get Inspired by Watching the Latest Springy Webinars
By Hannah on May 20, 2025

With a packed conference schedule, new product releases, and numerous updates on the horizon, we've been buzzing with activity over here at Springshare! In fact, we've hosted numerous exciting webinars recently that you should definitely catch up on to make sure you're getting the mos …
Upskilling Student Workers with LibWizard Tutorials
By Hannah on May 16, 2025

Engaging staff training is essential for improving information retention. Our LibWizard platform allows libraries to design custom tutorials with multimedia, instant feedback, and accurate assessment. And the best part? It's super easy to set up and use! We recently spoke with Erika W …
LibChat on the Go: Meeting Patrons Where They Are
By Hannah on May 13, 2025

Real-time virtual conversations are made easy with LibChat! This LibAnswers module is a reference powerhouse that provides an effortless way for patrons to chat with a librarian from any device. Seamlessly integrate custom chat widgets into popular LibGuides, discovery layers, or any …
Springshare Hits the Road for May Conferences!
By Hannah on May 8, 2025

Look out, here we come! We have a very full conference schedule this month and are thrilled to be able to meet up with library workers from all over the country. Be sure to stop by our booth if you're attending any of the same events because we've got quite a few new tricks up our sle …
Next Week's Webinar on New Springy Tools!
By Kelsey on May 5, 2025

Flowers aren't the only thing blooming this May! As spring unfolds, we're thrilled to announce a series of exciting updates to our beloved Springy Tools, alongside the unveiling of some truly groundbreaking new products that are set to transform your library experience. Join us on May …
- Community (56)
- Events (56)
- LibGuides (49)
- LibCal (47)
- LibAnswers (44)
- General (36)
- Product Update (31)
- Conference (24)
- LibGuides CMS (23)
- LibInsight (23)
- LibStaffer (21)
- Patron Point (21)
- Chatbot (20)
- LibChat (20)
- LibWizard (20)
- 24/7 Chat Cooperative (17)
- Tips and Tricks (14)
- SpringyCamp (12)
- Client Stories (10)
- LibMaps (6)
- Partnerships (6)
- Public Libraries (5)
- LibAuth (4)
- Accessibility (3)
- LibConnect (3)
- LibConnect Pro (3)
- LibSites (3)
- CareerShift (2)
- Consulting Services (2)
- Customer Service (2)
- Kudos (2)
- LibPost (2)
- June 2025 (1)
- May 2025 (9)
- April 2025 (9)
- March 2025 (6)
- February 2025 (6)
- January 2025 (7)
- December 2024 (4)
- November 2024 (8)
- October 2024 (6)
- September 2024 (6)
- August 2024 (4)
- July 2024 (7)
- June 2024 (5)
- May 2024 (6)
- April 2024 (7)
- March 2024 (5)
- February 2024 (7)
- January 2024 (6)
- December 2023 (5)
- November 2023 (3)
- October 2023 (5)
- September 2023 (5)
- August 2023 (5)
- July 2023 (4)
- June 2023 (4)
- May 2023 (6)
- April 2023 (4)
- March 2023 (5)
- February 2023 (4)
- January 2023 (4)
