

Data-driven decisions. Actionable Insight. Multi-variable Analytics. Dashboard Reporting. You hear these buzzwords anywhere and everywhere these days, and libraries are no exception. Gone are the days of tick sheets and anecdotal evidence.
Libraries need robust data gathering and data analysis tools to help them make everything they do… better, more effective, more engaging, more user-focused. That’s why we developed LibInsight – we want every library to have an affordable, easy to use data-gathering and analysis platform so that all these buzzwords become part of the regular library workflow.
Springshare sat down with two libraries to learn how they’re using LibInsight at their institutions to successfully streamline data workflows – City, University of London and the University of Pittsburgh.
City, University of London Libraries
by Derek Mackenzie, Head of User Services
Capture Data with LibInsight
We use LibInsight to record enquiry data at all our library help desks, as well as recording and analyzing data from other systems, e.g. circulation data, user access data (through our library swipe access points). The analytics element in particular has been useful in pulling out statistics and trends to highlight in reports – for example in papers for University committees, or data we share with staff to help review what we’ve been doing.
We’ve also introduced library school students at City to the delights of LibInsight – I’ve given a workshop session to the Masters students over the last couple of years to look at library data and analytics. I’ve used the datasets to give them an insight into how we can extract meaningful stats quickly and put together a dashboard with some questions for them to consider around trends in library use (visits, loans, enquiries) over recent years.
Enhance ILS Reporting Capabilities
We import checkout and hold transactions from our library system into LibInsight circulation datasets, as our library system allows only limited analysis of statistical data. We recently used the holds dataset to identify the most requested books in different subject areas so that we can try and source ebook alternatives as part of a project to make required readings as widely available as possible to students.
|
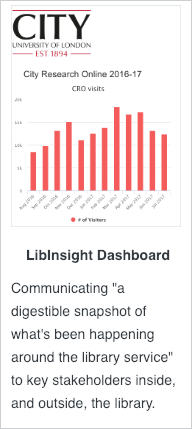
Dashboards Show the Library’s Progress We’ve packaged some of the key library activity data into a LibInsight dashboard. This shows enquiries (in-person and online), items borrowed, usage of our online reading list and digital repositories among other measures of library activity. We’re planning to present this to the Library Committee (which consists of senior academic staff from all the Schools at City, other Professional Services staff and Students Union representatives) ahead of their twice-yearly meetings to help give them an easily digestible snapshot of what’s been happening around the library service. It’s also intended to be a resource for our library staff to dip into and keep up to date. |
 |
University of Pittsburgh Libraries
by Berenika Webster, Director of Assessment and Quality Assurance
 |
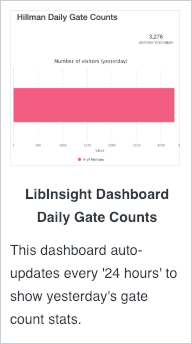
At the ULS, we have 20 “active” LibInsight datasets that are classified into three categories:
|
|
LibInsight provided us with a first step to start collecting library data into one place and allowing quick reports to all registered users. For instance, Liaison and Instruction Librarians can produce evidence of their activities for annual reviews; service heads can see patterns of use of their services to adjust staffing levels, and COUNTER reports are used when considering adjustments in journal subscriptions. Because we need deeper visualization of our data, we appreciate LibInsight’s ability to export our data into Tableau. |
 |
Learn More: Live Training, Videos, & Recent Updates
- New Features: We’ve added a ton of new features to LibInsight, including automated SUSHI-fetching.
- Learn About the Dataset Types: LibInsight is structured around the dataset, or the ‘type’ of data you are creating inside the system from Circulation data to E-Resources/Database Usage Stats. These short play & pause videos allow you to learn all about the different dataset types at your own pace.
- Upcoming Training Sessions: Attend our live webinar training and ask Springy Trainers questions in real-time.
- Getting Started with LibInsight: Monday, Feb 11: 2pm – 3pm Eastern Time
- LibInsight: Custom Datasets: Thursday, Feb 28: 2pm – 3pm Eastern Time
- Get more information on LibInsight:
- Get a free 30-day trial of LibInsight and kick the tires!