An Easy Way To Get Important Data You Need.
Libraries are working very hard to provide excellent instruction, easy access to information, and responsive service relevant to the needs of their students, faculty, patrons, and staff.
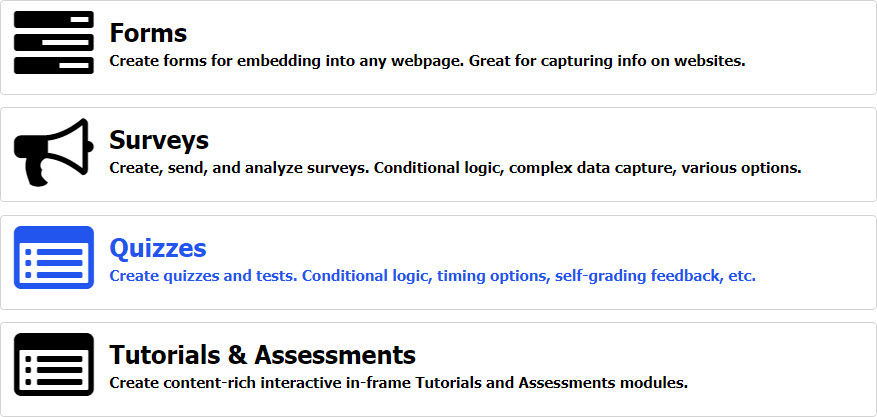
If you know a little about LibWizard, you probably know that it allows you to make an unlimited number of custom tutorials, forms, and surveys. These are great for gathering feedback to help you know what you could be improving or doing away with, what patrons are enjoying and what they want even more of from the library.
However, Prince Georges Community College is also using LibWizard to build quizzes. Their library team has prioritized assessment and are taking a serious look at whether their students are learning. In the end, doesn’t all the work come down to this?
If You Know What Features You Need, It’s Easier To Find Your Solution.
Marianne Giltrud wears many hats as an Assistant Professor, Instruction Librarian, and Secretary in the Faculty Senate Academic Council at Prince Georges Community College. Assessment is one of her responsibilities. She relayed why she needed to find a new tool to address it. They had quizzes built using some older technology. The person who created them left and neglected to hand over the admin rights so it was impossible to access the assessment data. Since Marianne was in a position to find a solution, she wanted one that could yield the data that she needed. Recalling her search, she said,
We used Google Forms for most of our surveys and forms. However, the google forms/spreadsheets do not provide robust enough data, for assessment. You can do pivot tables but not everyone can do them. LibWizard reports are easier to run and use.
I have used Survey Monkey for a variety of things, but it really isn’t designed for quizzes, per se. You can ask questions that are on a Likert scale but it doesn’t have the features like conditional logic, grading, feedback, timers, and more. LibWizard gives you a lot more options and ways to slice and dice the data.
Marianne chose to use LibWizard for a number of reasons. She said,
We already use Springshare products like LibGuides, LibAnswers, LibGuides CMS, so it made sense to go with LibWizard. However, it really was the reporting feature with Excel spreadsheets, the charts (pie, graph, bar, and table) and the quiz question features (conditional logic, grading, feedback, and timers) that was the deciding factor. Moreover, we had considered a proprietary InfoLit Tutorial but found that the assessment reports were very basic and it wasn’t customizable enough for what I needed.
The Goal Is To Assess Learning.
It can be taken for granted that the students are learning. Academic institutions are fully aware that this is a dangerous assumption. Marianne said,
Student success is a key metric for the college. Thus, assessment is very important to ensure that students are learning what they need to learn. We report student assessment in many ways.
The Library and Learning Resources Division strategic objectives tasked to me were:
• the creation of the interactive videos and with specific measurable outcomes.
• the creation of an information literacy instruction pre-test and post-test to assess learning in a one-shot face-to-face instruction.
Both of these required assessment data based on specific learning outcomes. I just reported the data in the FY 2017-2018 Strategic Plan. You’ll find more and more colleges and universities are looking at relevancy, assessment, student success, and ways to engage users.
Marianne had a plan and executed it. She said,
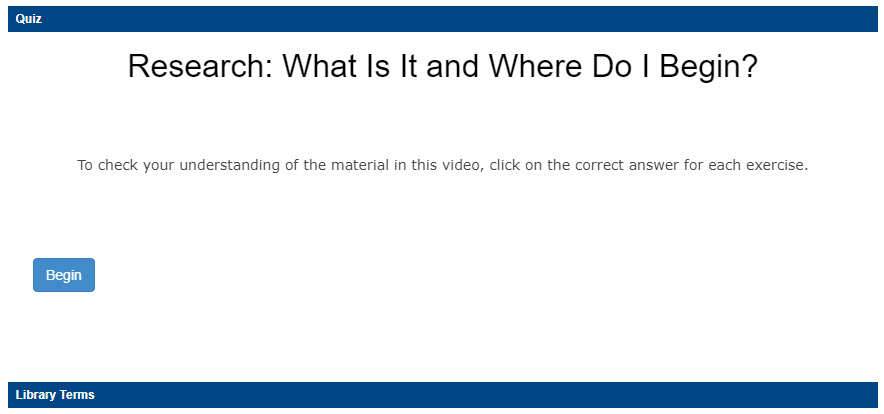
I created eight videos/tutorials and embedded the quiz at the end. I then embedded everything in a LibGuide Frame. In addition, we placed the Research Tutorial videos with a link to the quizzes on our YouTube channel.
Since I wanted to assess the learning, a quiz was the best option for me. I also wanted to use the grading feature, so that students would get the score once they completed each video/quiz.
You’ll find four quiz questions per video (32 questions in total). I created the learning outcomes and relevant quizzes based on the Association of College and Research Libraries Framework for Information Literacy as a guide to test the students’ knowledge. I created mostly multiple-choice questions but a few were true and false.
The End Of The Story? Done Correctly, It Never Ends.
The response to the work that the Prince Georges Community College Library has done with LibWizard is favorable.  Marianne said,
The Library Director likes the data because it can be reported in the measured outcomes section of the Strategic Plan under the Unit Goals.
Faculty like how we have constructed a way for the students to get a copy of the grades directly or the students can take a screen capture of the grade at the end of the quiz and send that to their professor.
Even Marianne is happy. It’s funny how sometimes in order to begin to envision a good solution — you must first think about what you want to get out of it in the end. This was that kind of project for Marianne. She said,
The Statistics report gives a high-level overview including the mean, average and standard deviation. I like bar charts and tables for most of what I am conveying.
LibWizard is easy to use and the quizzes are can be built without a steep learning curve. It’s mostly a text editor.
Now, the students can keep viewing the library’s tutorials and they can keep taking quizzes afterward. The data will let the library know if learning is, in fact, happening — which is, of course, the best case scenario.


Nice Work Marianne! This is a great idea and I can definitely find some things to ‘bring home’ here!