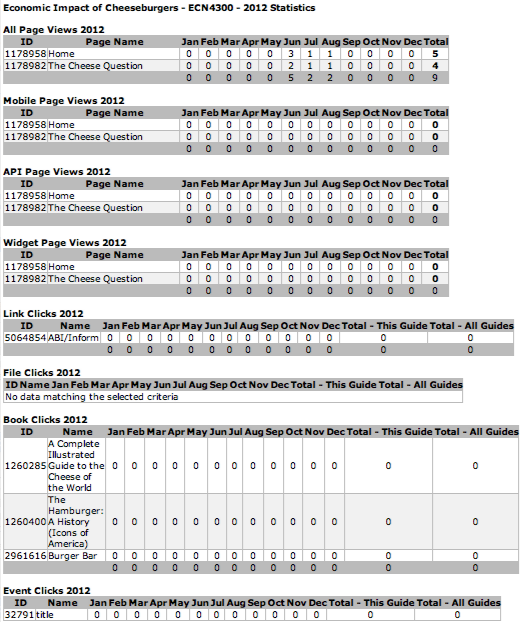
Earlier this month, we rolled out a huge statistics update – huzzah! We’ve heard lots of good feedback about the new functionality – words like “awesome”, “fascinating”, and “super cool” have been flying around. We’ve also heard from some folks who miss the simplicity and scannability of the previous monthly hit reports.
We’re all about easy, so we’ve added these reports back in to the new stats interface! Here’s how to get them:
- Head to Statistics, & select the Guides tab
- Choose Monthly report, then select the months you’d like to see (ex: January to August); click Apply

- Look below the chart, and you’ll see the Monthly report grid:

- Select a guide to see a grid breakdown by page; click Links to see grids on links, books, files, etc.
- Prefer seeing all clicks in one report? Choose Export to: Excel or Plain Text to view all guide clicks:

Thanks to everyone for sharing feedback on the new statistics!


