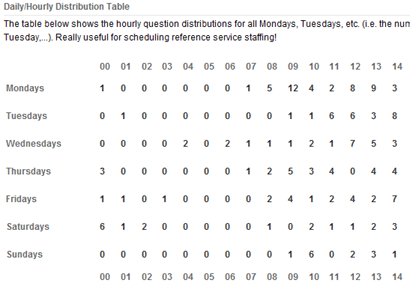
We have added another statistics report to the already sizable Reference Analytics module functionality – the “Daily/Hourly Question Distribution” table. The report is available from the “Reference Statistics” and “Reports Wizard” screens in the Reference Analytics Tab.

The report shows the number of questions asked each hour, for all Mondays, all Tuesdays, all Wednesdays, etc. during a specified time period. Since the daily reference patterns can vary greatly depending on the days of the week, this report is really helpful in determining what are the busy periods for reference, so that you can staff accordingly.
With this new report in the LibAnswers Analytics module you can even get the daily/hourly distributions at specific reference service points, i.e. at any number of service points you define in the Analytics module.
If you think of any other reports ideas for the Analytics module, please do let us know. Props to Susan @ LMU for giving us the idea for this report.


