Customize your LibInsight charts to match your organization’s official color palette, or customize Dashboards per review period or project.
Define your custom colors at the system-wide level and you’ll see them in your dataset analysis charts, cross-dataset analysis, and dashboards.
Head on over to System Settings to set your system colors. If a chart requires more colors than you’ve specified, random colors will be chosen.
If the Randomize box is checked, the colors will be used in random order for charts in Analysis, Cross-Dataset Analysis, and Dashboards.
Here is what custom colors look like in charts for Electronic Journal / Database:
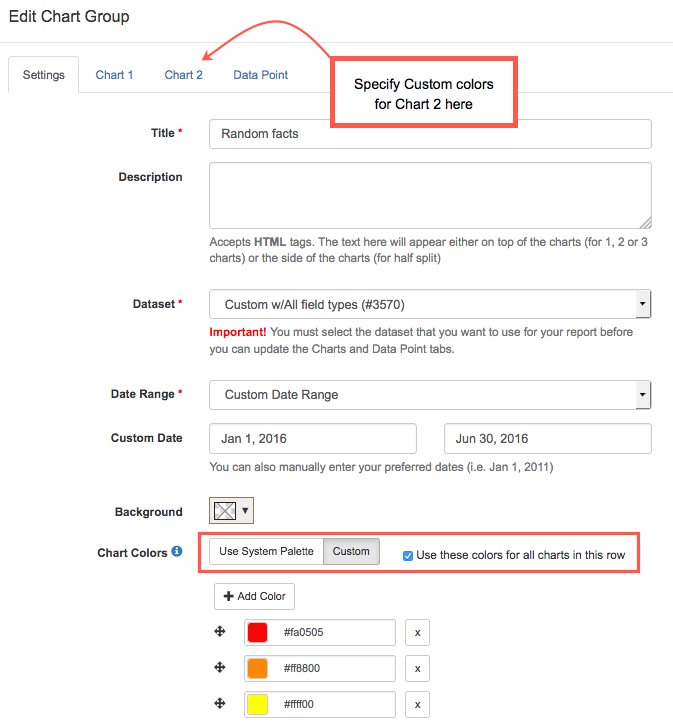
You can customize Dashboards further by using the System Colors palette or choosing custom colors in the Dashboard. You can even use a different set of custom colors for each chart in a Dashboard row. Use your power for good! 😃
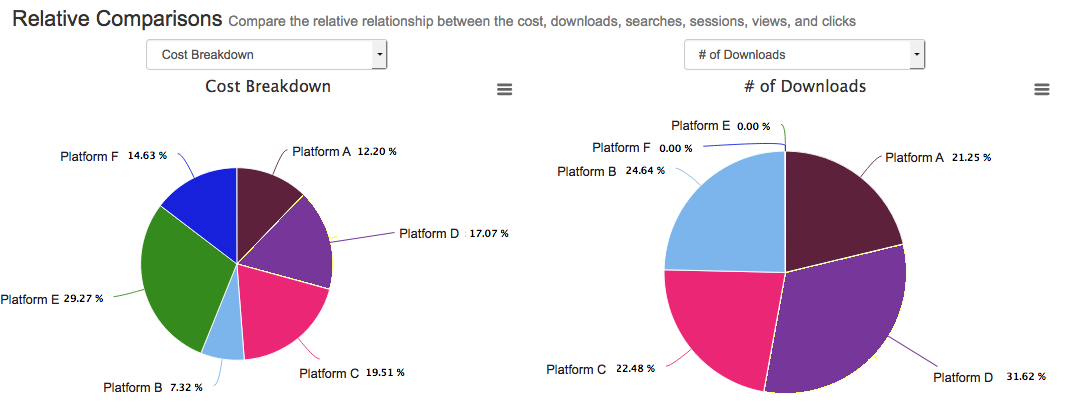
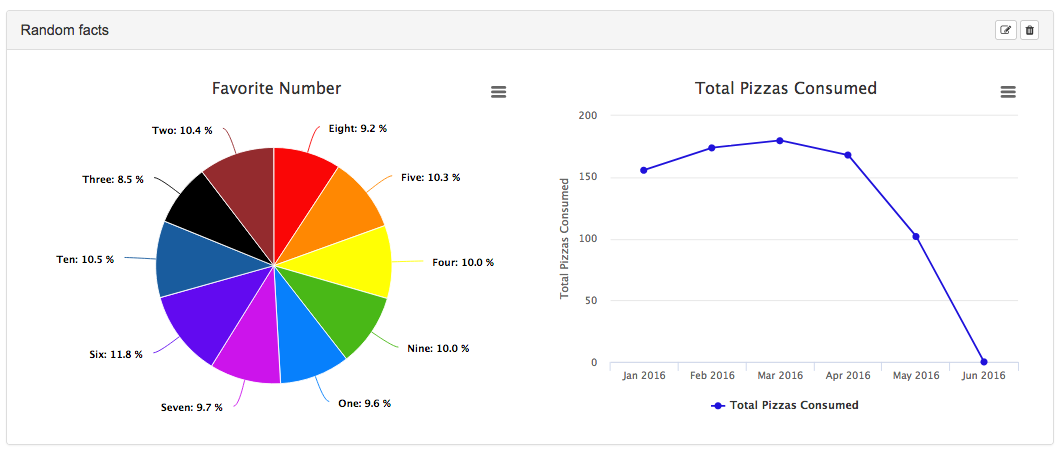
Here’s a screenshot of a Dashboard row with custom colors specified for each chart.
Specify custom colors for all charts in a row on the Settings tab (check the box to apply to all charts), or specify custom colors on the other chart tabs.