New Chart Type in Dashboards
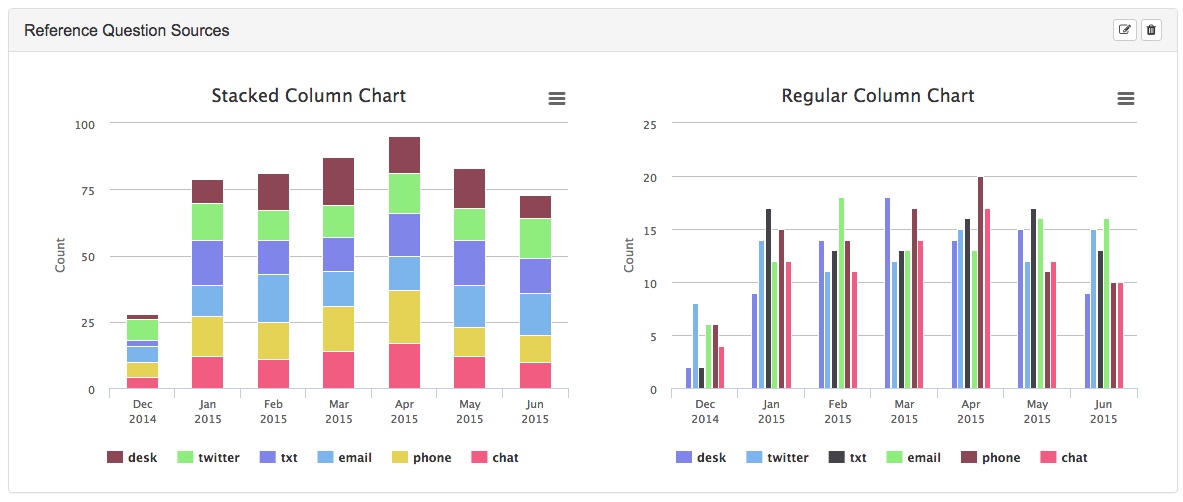
We’ve added a new chart option in Dashboards; the new Stacked chart option lets you visualize the multi-select or single-select fields in your custom datasets in a new way. Here’s a side-by-side comparison:
While both visualize how different answers compare to one another, stacked charts have the added bonus of indicating the rough total for each option. Stacked charts are available for Bar, Column, and Area charts. They’re only available for Custom datasets right now, but we’ll be bringing these and more to other dataset types.
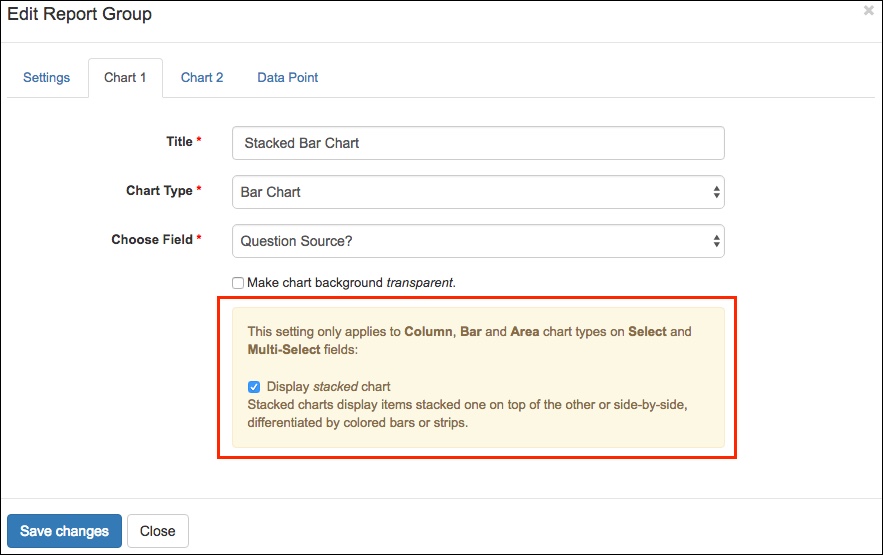
To try out a Stacked chart, create or edit a Dashboard using a custom dataset that contains a Single Select or Multi-Select field, and check the optional Stacked setting:
This is just the first step toward more robust and flexible Dashboards. Watch this space for more news! 🙂
Widget Previews
Do you find it annoying to have to find and copy the URL for an LI widget to see what it’s going to look like? We did too! There’s now a preview button that will open your widgets in a new tab.
Attach license (and other) files to your database, e-journal and eBook platforms!
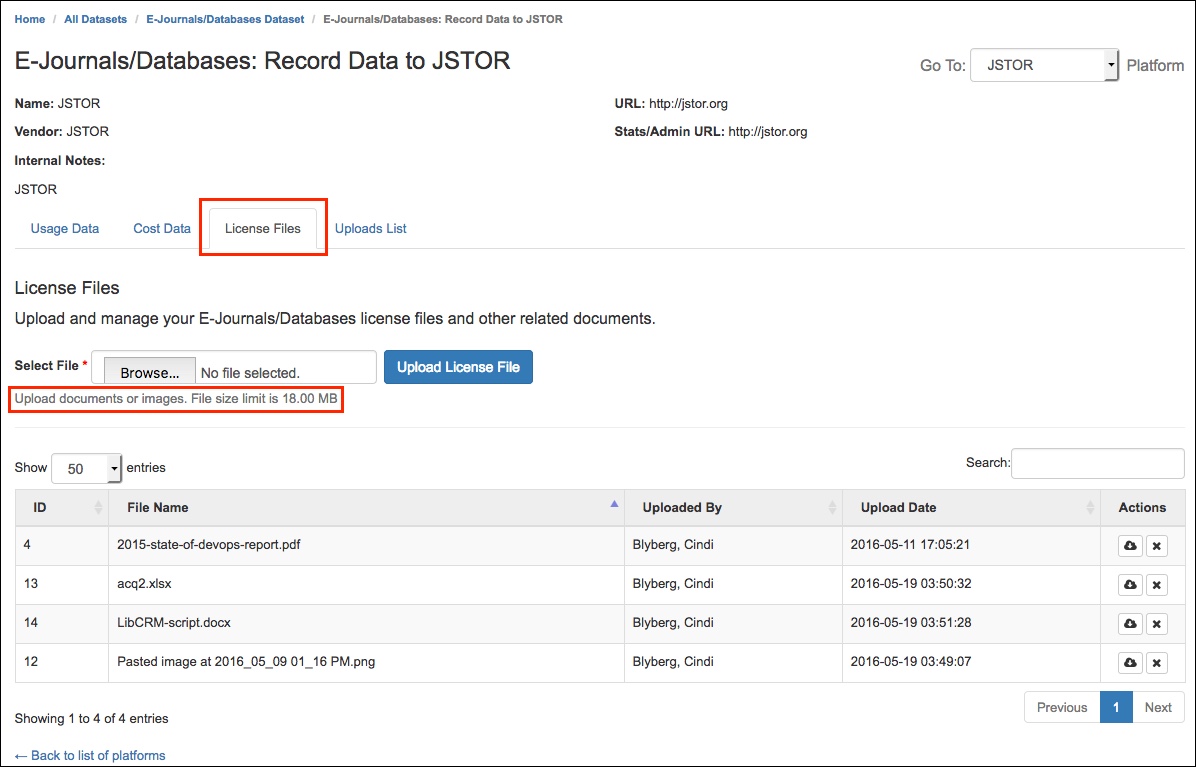
When you go to add data to your E-Journals / Databases or eBooks datasets, you’ll see a new License Files tab. There you can attach license files or other important attachments. You can also link directly to this tab from the Platform Management modal (Admin > Manage Datasets > your dataset > Edit Platforms > edit a platform > Manage License files)
Improved field creation process for Custom datasets
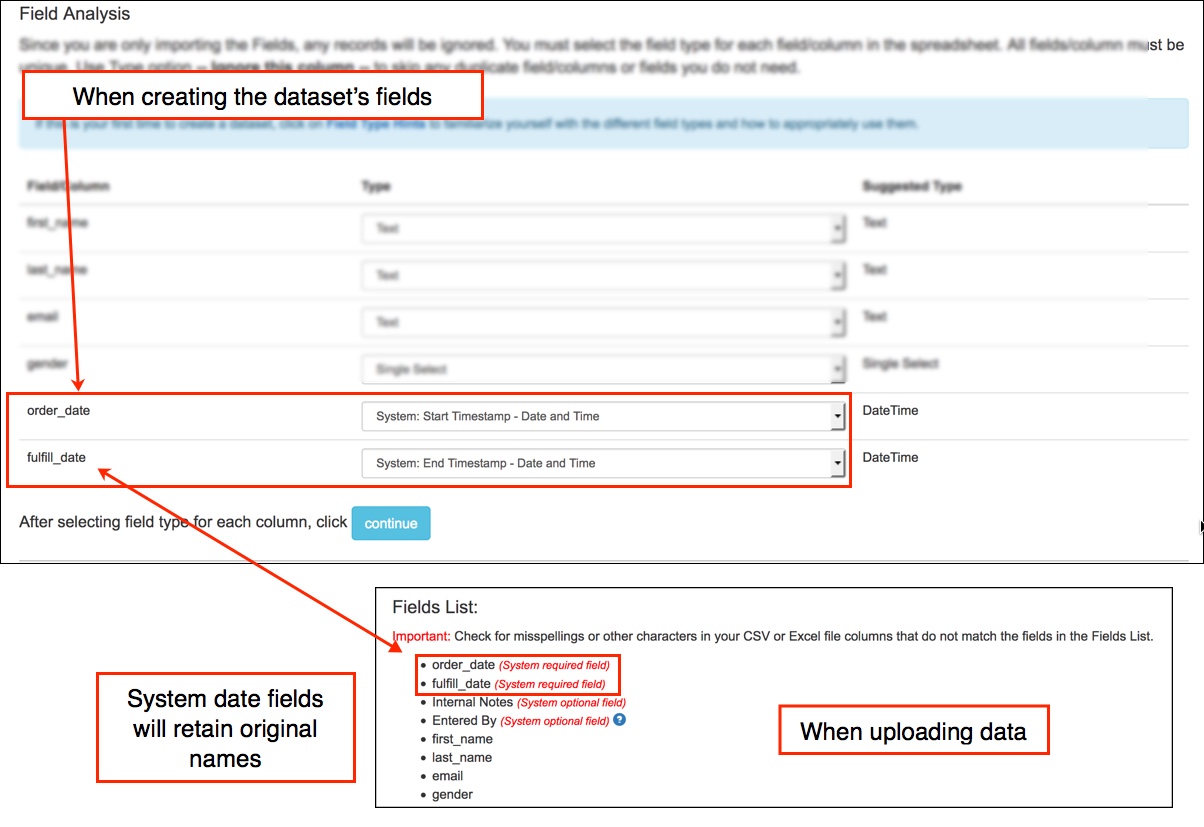
Before this release, the system date fields for Custom datasets in LibInsight were always named “Start Date” and “End Date.” This often added a couple of steps to the upload process, if the names of your date fields did not match these exactly. Now when you create a Custom dataset and map your date fields to the system date fields, your field names will be retained.


