

We have some fantastic news for Electronic Resources Librarians as we head into invoicing and end-of-year stats gathering season. Are you ready for database-level statistics??
With the latest LibInsight code release, you can upload the COUNTER Database Report 1 (DB1)—either by uploading files or by retrieving them via SUSHI, if the publisher supports it. You’ll notice that the Analyze screen looks a bit different, too, because we changed some stuff up to get database stats into your hands.
Adding Database-Level Statistics
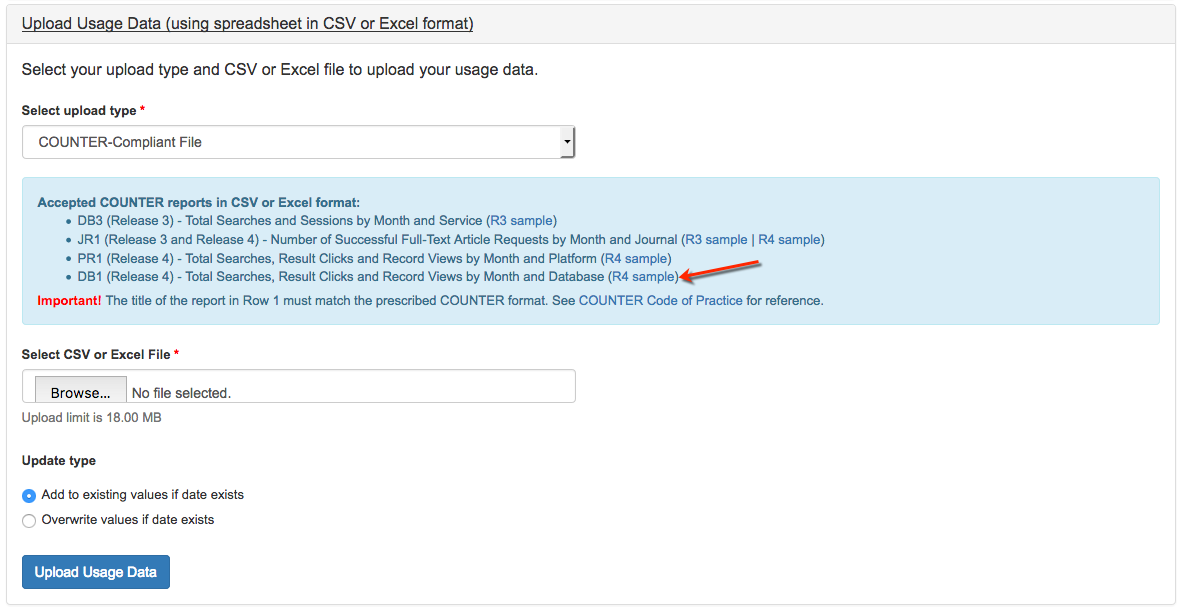
To upload your COUNTER files or retrieve a SUSHI file (or enter them by hand if that floats your boat!), go to the Record Data screen for your E-Journals/Databases Dataset. Need a sample file to compare to the data you get from publishers? Click Upload Usage Data then look for the R4 Sample link on the DB1 line:
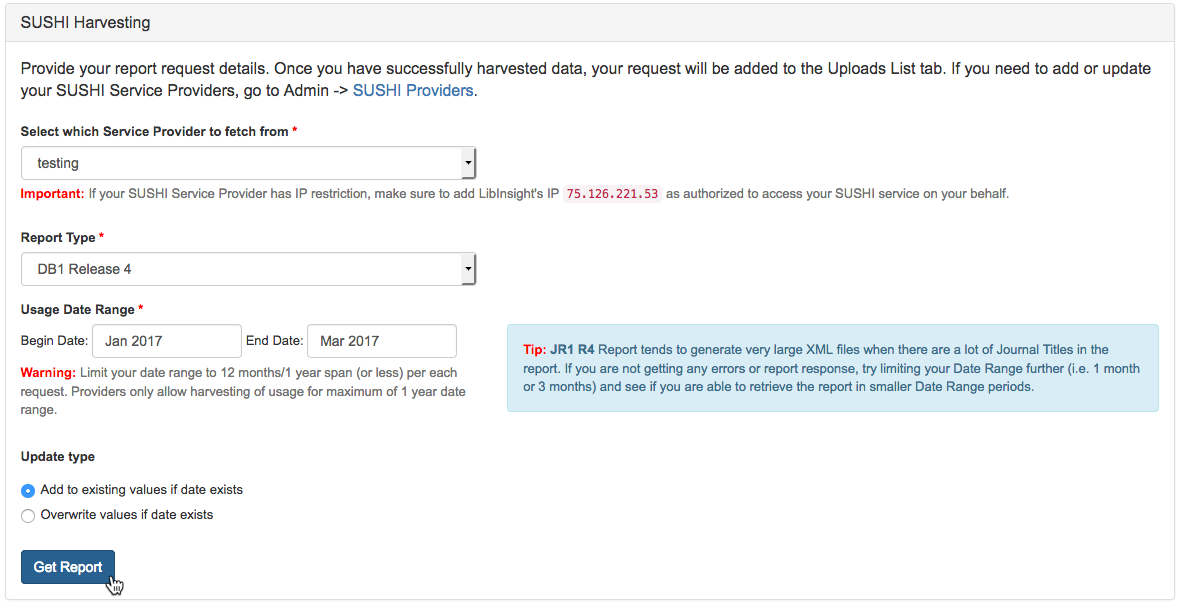
Just want to grab a file via SUSHI? No problem! Click SUSHI Harvesting, choose your provider and report type, specify your dates and away you go!
Analyzing per-database data
Do you want to dig into your e-resources data to see which databases are used the most? Which are not really used? Do you have the same database through different platforms and want to keep track of which gets the most use? Which databases get a lot of searches but don’t generate a lot of clicks or views? You can get at the answers to these questions and more with Database Use Statistics!
First go to Analyze and run a report on an E-Journals and Databases Dataset. The Overview tab initially presents data for all platforms in your dataset. Use the Searches, Views, and Clicks variables to see data uploaded via PR1 and DB1 reports – if a DB1 report has been uploaded, those platforms will show the number of databases they contain. If you’ve added cost data, LibInsight automatically calculates your cost-per-use. Psssst you can see which journals are contained only by uploading the Journal 1 (JR1) report.
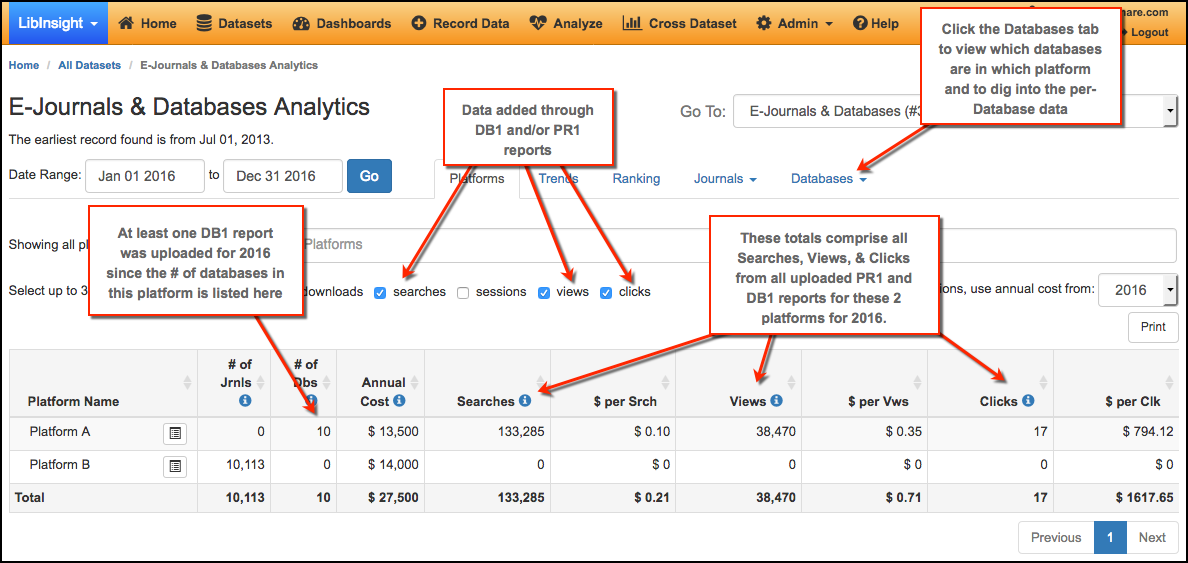
To view statistics by database, click Databases > Database Use. The real fun begins below the table that summarizes how many databases each platform has. When you view the database list for each platform, you’ll see the Searches, Clicks, and Views attached to each database.
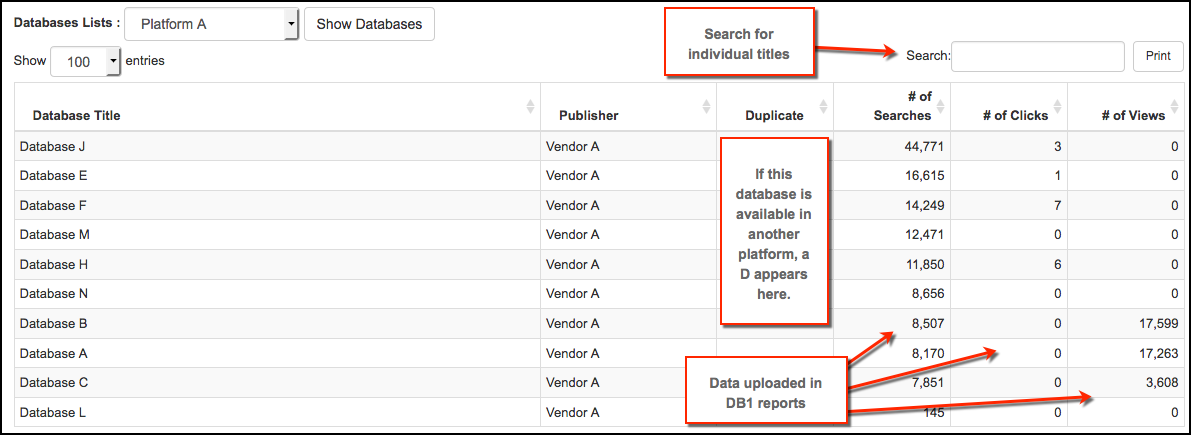
Click the Databases tab > Top/Zero use to see your most-frequently-used databases as well as those for which there are zero stats. You can view these across all your platforms or just rank them within a single platform.
Expanded and Easily-Discoverable Platform Information
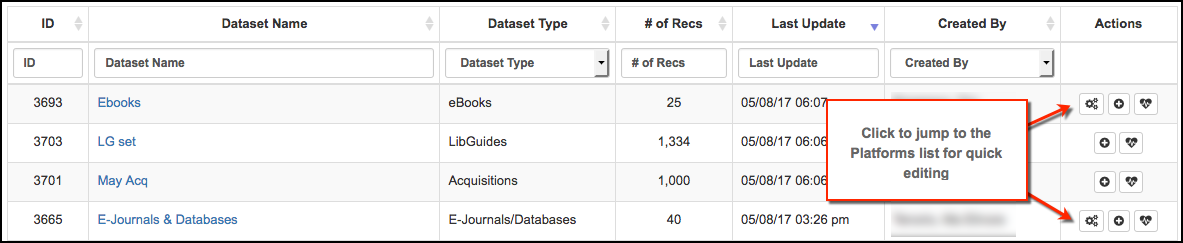
We’ve made it easy to enter and find more information about your e-resources platforms. On the All Datasets and Manage Datasets screens, you’ll see a cogs icon in the Actions column for E-Journal/Databases and eBooks datasets. Click that to jump to your platforms list to add new or edit existing platforms.
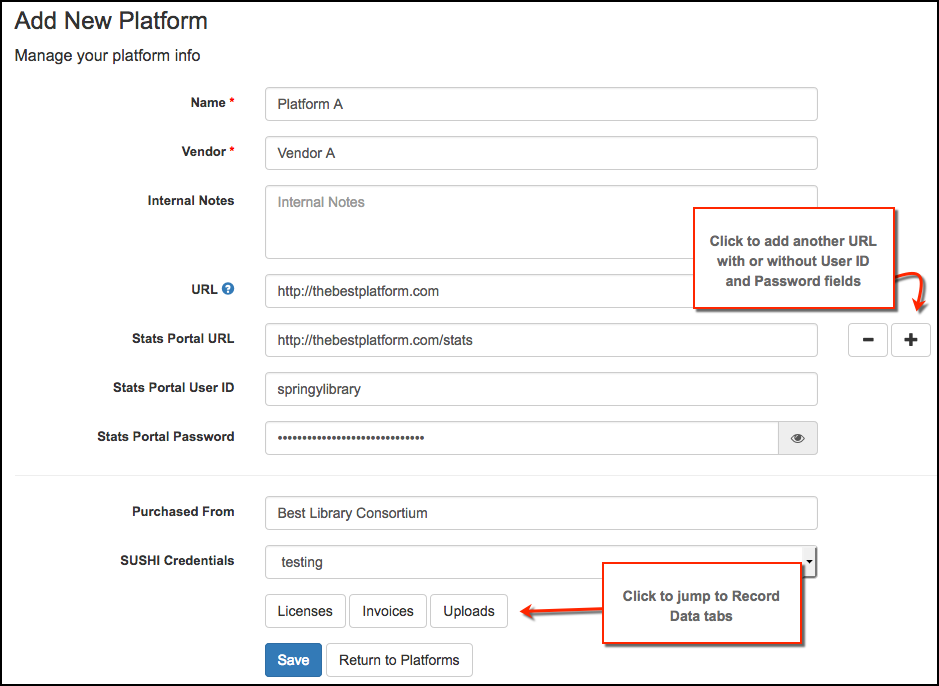
We have also added a bunch of fields as well as easy jump points from a Platform page to its corresponding Licenses, Uploads, and (NEW!) Invoices tabs. Now you can track which SUSHI credentials to use and add URL, user ID, and password fields for affiliated sites, like administration or statistics portals.
New Cost Data Options
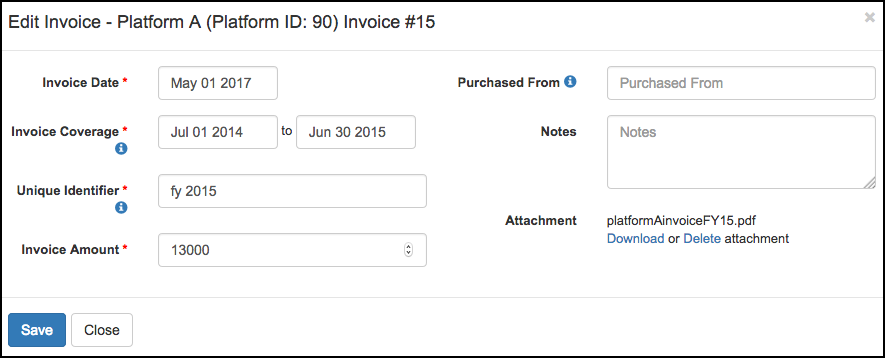
Last but not least of our big new features this month is the ability to attach 1 or more invoices to your e-resources platforms. Go to the Record Data screen or click the Invoices button on a Platform’s information screen to add, view, and edit Invoices. Currently, you can add a date, coverage dates, amount, and an attachment. Coming soon will be the ability to add line items to your invoices! Line items will be used to calculate cost-per-use at the database level in E-Journal/Database dataset analysis.
Already added Annual Cost data in your e-resources datasets? No sweat, that option is still there for those who prefer to enter a single cost per platform per year. This may be simpler for smaller platforms that do not come with multiple invoices.
More Dashboard Time Period Options
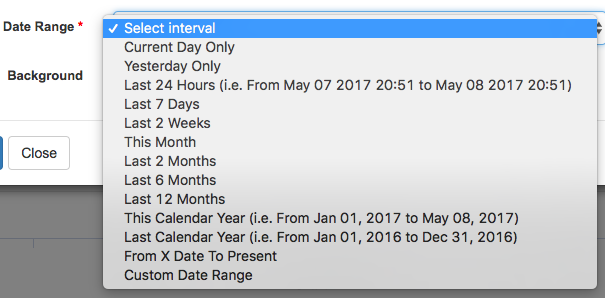
You asked for more options when graphing data in a Dashboard, and we’ve added a bunch! Now you can chart the last 6 or 12 months, last calendar year, this calendar year (to date), or even a custom date to present. The existing options are still there, so if you’re after 2 weeks, 24 hours, or a custom date range, the gang’s all here!
Additional Features
As they say in infomercials, but wait, there’s more! We’ve been busy bees indeed at Springy HQ, and we’re pleased to also announce these smaller fixes and features:
- Filters area on pages containing tabular data (All Datasets, Accounts, etc.) allow you to add more than one limiter at a time
- Gate Counts recorded daily or more frequently contain Weekly graphs
- Entered By is a chartable field for Custom Dataset Dashboards
- Browser / OS charts are available for Google Analytics Dashboards
- SUSHI Support for ProQuest eBooks Central
- Split out Finance graphs into Expenditures & Revenues
- Added “All fields” to Counts > Analyze > Distributions field choice
- Domain validation for Shared Datasets
- Date picker: default to 1st of the month if user chooses only month and year
- Accessibility update: fixed poor contrast on Gate Count widget buttons
We also had a few bugs to banish:
- Select fields displayed as pie charts in custom dataset analysis now display their proper labels
- When the System Name is changed in System Settings, that change is sent to LibApps and displayed on the LibApps dashboard
- Admins were unable to delete or unpublish Others’ dashboards—no more! We have restored this phenomenal cosmic power!
- If you didn’t use the previous gate count value as the subsequent gate start field, the Daily Total could be off. We’ve fixed this!
- We realized that rounding up when calculating the bidirectional gate count was resulting in a handful too many people at the end of each day. We’ll only round up at the end of the day, because who wants a half a patron?