

Get Me Some Actionable Data…STAT!
This is the world we live in. We need proof to try the pudding. 15 years ago, people simply went to a restaurant, chose a vacuum, or took a gym class. Now, most people spend a considerable amount of time doing research before major and even minor purchases. Just think about how many reviews you’ve read lately for a mobile phone case. How many stars does it take for you to choose a taqueria? Forbes says, “82% of smartphone users consult their phones on purchases they are about to make in-store.” Librarians have known for a long time that keeping statistics is important. Having actionable data is key.
Grid And Bear It.
Springshare understands how valuable metrics are to libraries. You’re in the service industry. It’s critical for you to keep track of usage, to measure growth, and to gather feedback. You have to be able to make assessments about which efforts are yielding positive results and which programs or classes are no longer popular. Springshare has statistics built into every tool. Since the love of data is now a very cool thing, we wanted to geek out and share some great charts and graphs you can dazzle people with at the staff meeting.
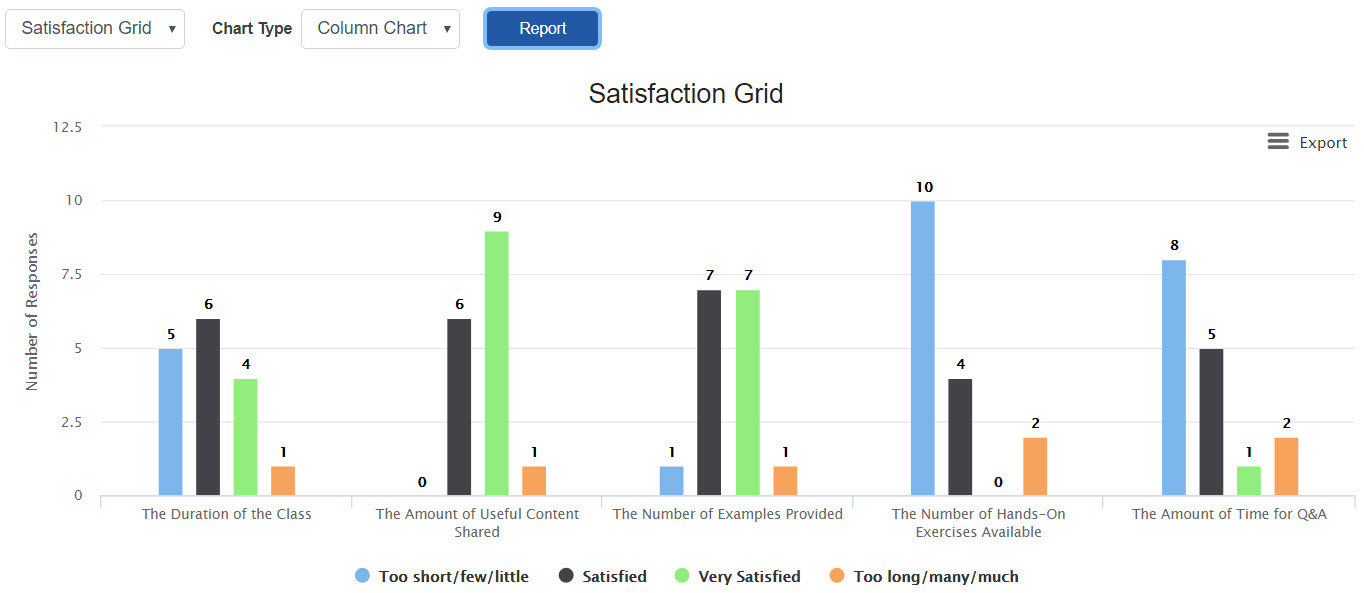
LibWizard allows you to easily build custom forms, surveys, quizzes, and tutorials. If you choose the Grid Field, you can get feedback on a number of related questions all at once. Looking at the data through the varied chart options can quickly help you make some decisions about, in this case, improvements to library instruction sessions. As we can see from this Post-Instruction Survey, the attendees thought the class was maybe a bit short. And, while they thought it had great content and examples, it didn’t have enough hands-on exercises and there wasn’t enough time for questions. How incredible would it be for your team to have this kind of evidence?
It’s All About The Filters.
LibCRM is our Customer Relationship Management tool designed specifically for libraries. It’s amazing what this system helps you keep track of from projects and tasks to the complexities of relationships and memberships to recording all the work you’re doing to be of service and build a rapport.
But this system isn’t just wowing people because of what it can hold. It’s surprising folks with what you can extract. You choose the filters and get the intelligence you need.
Here’s a report on Adjunct Faculty Who Don’t Communicate with the Library. Being able to run a report that can filter through scores of records to display these specifics is beneficial. You could then spearhead a project to boost your outreach that gives you a real place to begin.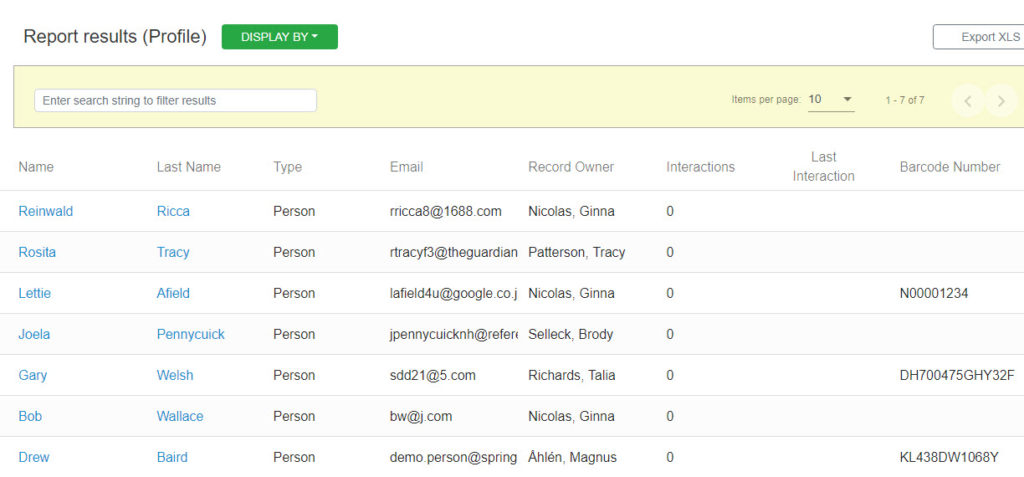
Don’t Just READ Into It.
The READ Scale or Reference Effort Assessment Data has been around since about 2002 when an ARL (Association of Research Libraries) survey was conducted and unearthed the problem that the READ Scale solves.
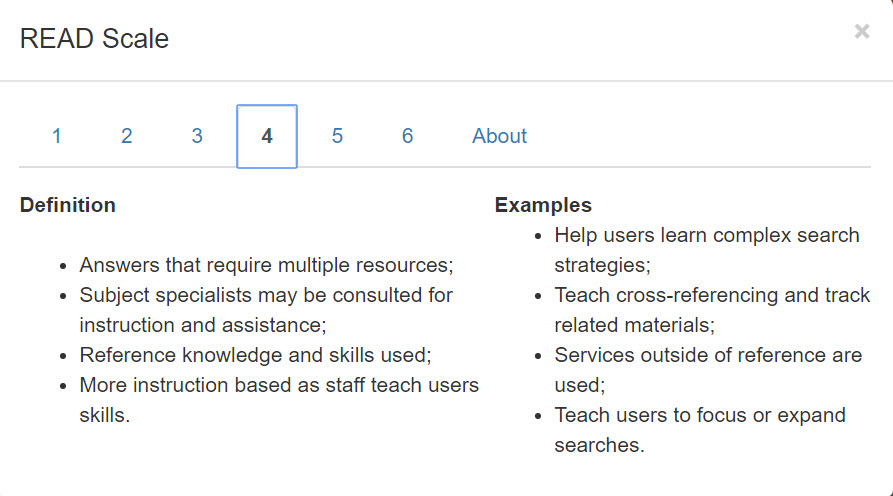 They had determined that it was necessary to spell out the efforts being made by librarians to help answer patrons. This ensures an accurate assessment of the work each interaction entailed.
Since inception, the LibAnswers Platform has provided librarians with the ability to select the READ Scale number that corresponds with the activity when recording the transaction. If you’re not already using it. You should! Data is most helpful when it is quantitative — in this case measuring effort. It justifies the need for professional librarians and their invaluable expertise. Plus, having this knowledge helps with scheduling. It’s easy to look at the time stamp in the stats. When the most difficult questions are being asked, you can make sure there’s a manager around.
Now, go ahead and check out the Stats and Reports features in all your Springshare tools to get the data that you need!