

Springys will be heading to Atlanta this week for ALA Midwinter 2017, but Springy HQ is still rocking and rolling out new features this week! First up is LibInsight 0.15, now available in a browser near you! Here’s the rundown:
Counts/Aggregate Dataset Type
As librarians, we count a lot of stuff! Whether tracking the number of visitors to the library, the number of questions answered at your desk, the number of attendees at your awesome programs, or the number of times your group study spaces are used, there are a lot of numbers you can use to demonstrate the value of your library to your university or board. While LibInsight does some aggregate counting, until now, its power has been in tracking and analyzing transactional data–think individual instruction sessions vs monthly instruction statistics. Weep no more, spreadsheet lovers!
We’re so pleased to bring you the Counts/Aggregate dataset type. Monthly collection counts? Check! Daily headcount? Check! Annual event attendance or instruction numbers? Check and check! Stack any and all of your regularly-counted numbers together in one or more Counts/Aggregates datasets.
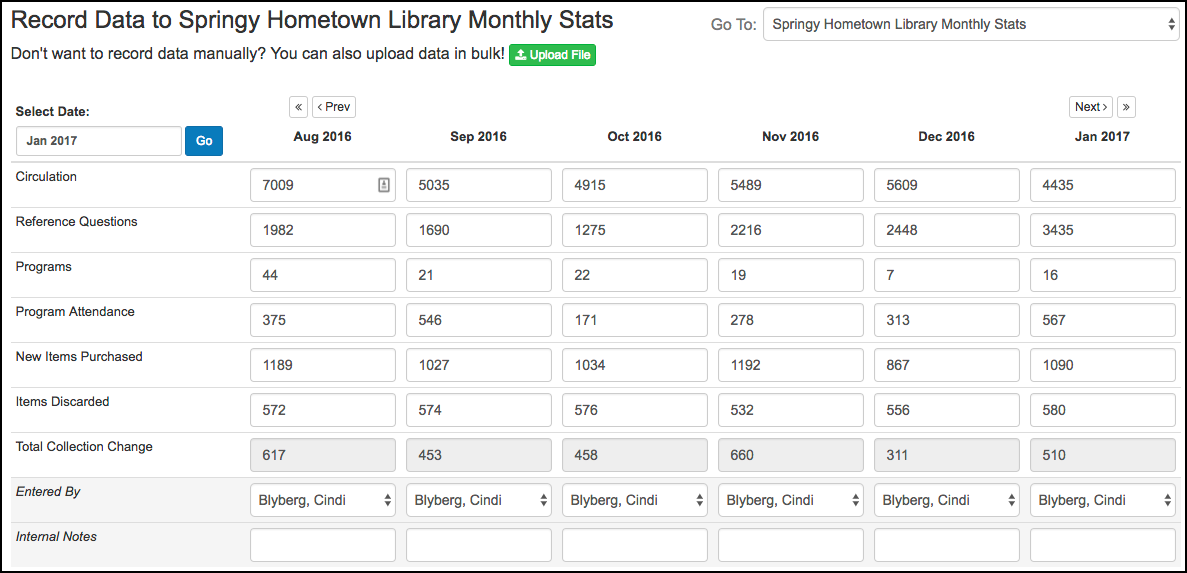
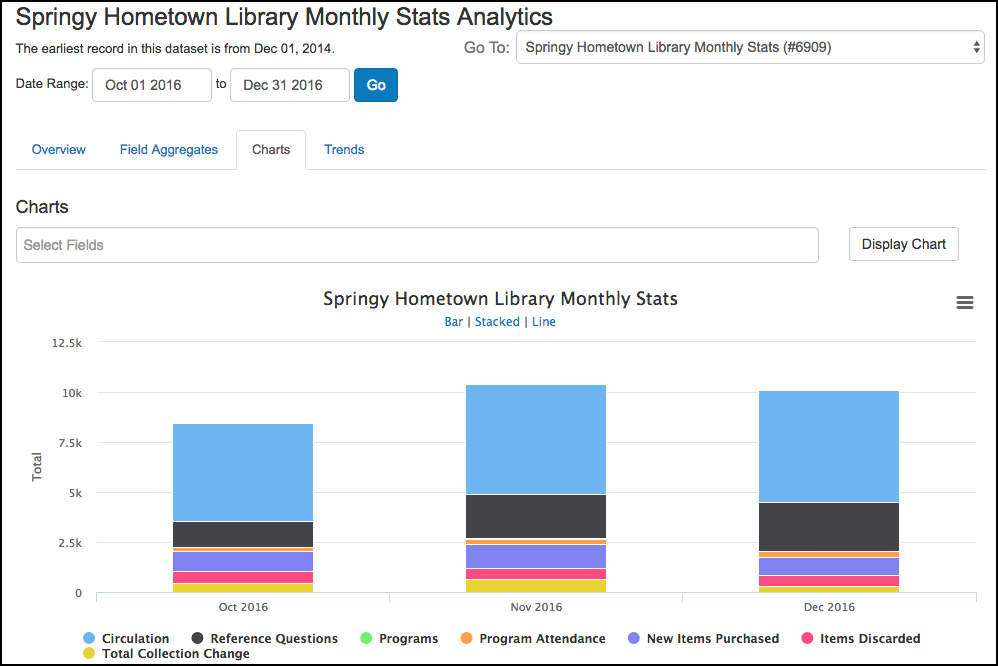
As with all LibInsight datasets, you get analysis for your Counts, too. View your numbers in tables, view dataset statistics, chart one or more variables, or even use the Trends tab to show how the counts change over time. Compare data from your Counts datasets with other datasets using Cross-Dataset Analysis to boot! Ready to show off your library’s numbers? Add your Counts dataset to a Dashboard for easy access. Ready, set, get counting! 🙂
Custom Datasets Get Trendy!
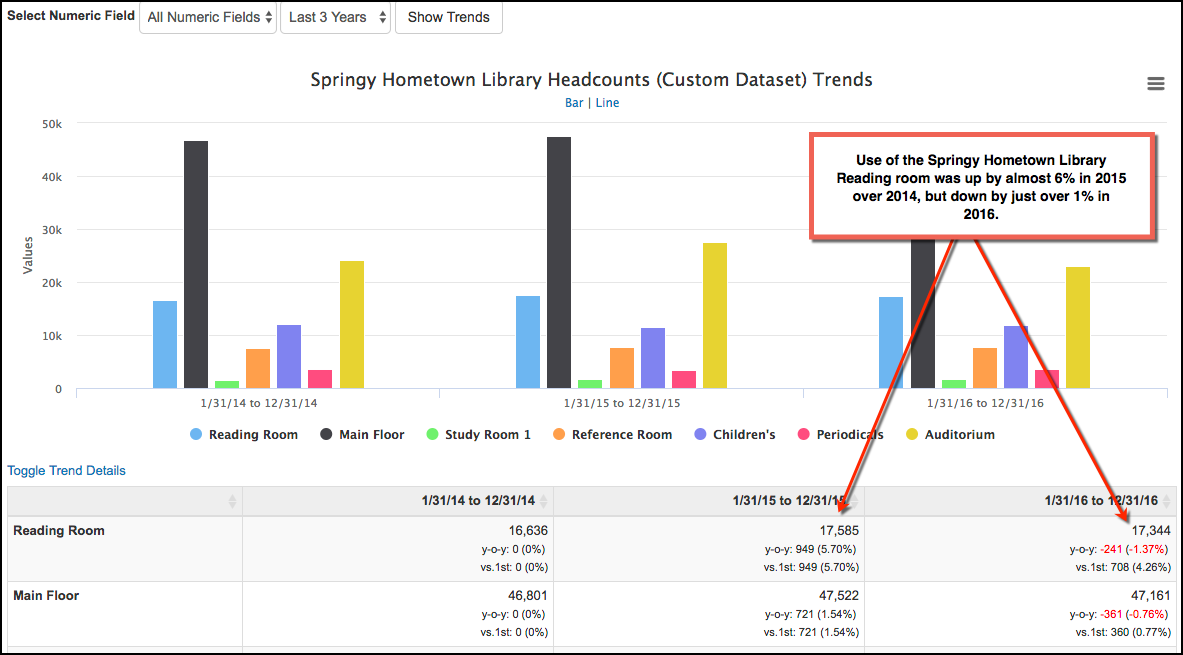
Do you use the Trends tab in your other datasets? Well, now you can analyze trends for the numeric fields in your custom datasets, too! See how the totals of your numeric fields change year-over-year, graphically and in tables. In the screenshot below, we see that use of the Springy Hometown Library Reading Room was up by almost 6% in 2015 over 2014 but slipped by just over 1% for 2016.
Have suggestions for additional Trends or other analysis for Custom Datasets? Click the Support tab on any page in your LibInsight site to drop us a line.
Additional Features and Fixes
Widgets
- Add the “Entered by” field to your dataset widgets to record who’s entering data.
- If Required Fields aren’t completed on Submit, these are highlighted.
Gate Count Datasets
- Allow “Null” values in Gate Count hourly datasets–no zeroes required!
- Added a date/hour picker for the Multi-Gate option in Gate Count widgets.
- You can now download your Gate Count data.
And more…
- More flexibility with setting your preferred fiscal year dates for analysis. Set this up in Admin > System Settings.
- Field order of CSV Exports now reflects your custom field order.
- We squashed a bug that was preventing 5-step scale fields from working properly
- We made SUSHI error messages easier to read.